
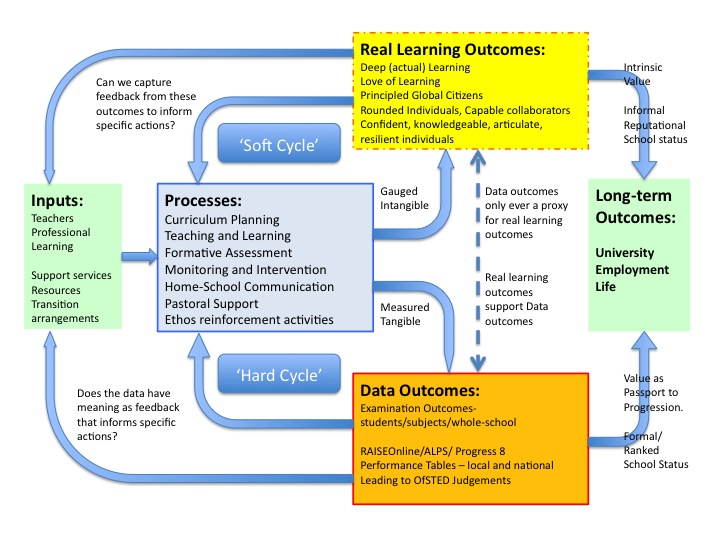
I produced this diagram as part of a paper ‘Measuring Success and Securing Accountability’ for my governors and SLT. One reason for writing it is that, along with everyone else, we face a very turbulent period in our examination system. Over the next few years, there are so many changes to the measures we’ve been using to gauge success, phased in gradually, that year-on-year comparisons will be difficult to make; predictions will be based on unreliable assumptions of linearity in the baseline-to-outcome trajectory and targets will be hard to set. I want my governors to have some tools to use that go beyond the data so that we can have realistic and meaningful discussions about success and improvement.
A second reason for writing the paper is to fuel a wider discussion about ‘measuring what we value’ – rather than ‘valuing what can be measured’. I don’t want my school to be a school where the headline GCSE figures dominate our thinking at the expense of broader notions of quality and success. With recent (necessary) changes to exams, that bubble has burst – and we can’t go back. The data outcomes matter a great deal to the students as passports to progression; they matter as proxy records of the knowledge they have gained – but they don’t tell the full story of the richness and depth of the learning experience – the Real Learning Outcomes. My view is that focusing on Data Outcomes is a self-limiting process; if the results matter too much, we don’t care enough about the underlying learning. We prioritise Y11 intervention over support for deep learning at KS3 and get caught in a never-ending cycle of 11th-hour scrambling to patch things up. Conversely, if we focus on Real Learning Outcomes, students receive a deeper, broader education and the results will take care of themselves.
However, the main reason for making this diagram is to consider the process of improvement and the nature and value of feedback. If I know that our Progress 8 score is 0.3 (farcically, 0.3 +/- 0.2), how useful is that in terms of improvement? Does that piece of data tell me anything helpful? Answer: No. It might do if the teachers in my school had low expectations of students and a low Progress 8 score helped to challenge that. But, if we’re already aiming high, most of the aggregated whole-school data gives us no information that can be used to inform an improvement plan. Over time we might see if we’re getting better or worse in terms of a particular data set but that’s not enough to tell us what to do to improve. For teachers, leaders and governors, this is problematic. If our results are disappointing, I don’t think it is good enough to simply say ‘do better’. Generalised striving to ‘do better’ is dangerous groping in the dark; it is hopeless. We must always ask “what specific actions should we take in order to do better?” and have some idea of the answer. I think governors should be able to have this discussion just as teachers and leaders should.
For this to happen, we need to focus less on interrogating the Hard Cycle data and more on understanding the processes. In truth, we don’t need much data of the aggregated kind. If we’re all working flat-out, the data that really matters is the micro formative data that tells a teacher which bits of knowledge and skill each individual child needs to improve on; this in turn informs how and what they teach. Even when exam results come out, the micro post-results data is the most useful: question by question feedback that gives clues about where to change emphasis in planning subsequent teaching sequences. Governors can’t know all of this detail – but they should know how it works and learn to ask questions about it. What other data might be useful in providing actionable feedback? I’d say that there is rich material in student and parental feedback via focus groups and ad hoc communication as well as feedback from teacher-led lesson observation processes. These are all aspects of what I’ve called the Soft Cycle. For example, I know three or four parents at my school who give me very sharp feedback about their child’s experience; they provide more actionable feedback than any number of sets of data. Soft Cycle data has many forms and we should gather it up where it can tell us something useful.
If we focus more on processes, the accountability role of a Governing Body and an SLT shifts away from at-distance requests for data – sucking up precious time and energy collecting information that can’t change anything – and moves towards the close-up process that builds up a detailed picture of the activities that actually make a difference. We start to focus on questions such as:
- What does a teacher do in Maths if a student doesn’t understand a concept or performs poorly on a test?
- How are pastoral leaders supposed to respond to report grades that say ‘Poor attitude to learning’?
- What is the optimal topic sequence in History at KS3 to provide a coherent preparation for GCSE and A level?
- How do French teachers use grammar test scores to inform next steps?
- Do the ‘Growth Mindset’ assemblies have resonance in the classroom or is there a fundamental contradiction in the way we give value to performance goals over mastery goals?
- What are the features of an effective feedback and marking policy that secures improvement over time without creating unsustainable workload pressure?
- Do our very most able students have a positive experience in Geography? How do we know? What does that actually look like? Is there a teacher CPD issue to address in this specific area?
- Have we got our setting policy right and how would we know?
This transition is a gradual one. It requires a degree of trust on all sides. You need to let people get closer to the details if you want them to understand them; if you keep scrutiny at a distance, then you have to accept that flawed Hard Cycle data will dominate – because that’s all there is. It’s challenging, not just in terms of the principles but also in practice. Do governors have time to really get in amongst the details? Certainly school leaders do but working governors can’t rely on attending meetings to understand the schools they govern. Not any more. And that’s a challenge.
Importantly, accountability informed by Soft Cycle feedback isn’t actually soft. In combination with the hard data it’s more rigorous and, hopefully, it is more accurate, more meaningful and more productive. It’s just a bit messy and rough around the edges. I think we can live with that. Especially if we’re serious about measuring what we value.

A great post – really thoughtful and a genuine attempt to marry accountability, assessment and learning experiences of the pupils.
LikeLike
Great post. Was it Fullan who said the “the soft stuff is the hard stuff”?
LikeLike
Probably – sounds like him.
LikeLike
Brilliant Tom. I, probably like yourself and countless others, have raised this issue a number of times over the years, and continued to muse on it, even when it didn’t gain traction at the various schools I’ve worked at. It’s great to have the topic distilled and streamlined in this accessible manner, as you have. Thanks, K
LikeLiked by 1 person
I love your diagram. I would add that there is great scope in using the RLO to inform how learning is designed in schemes of work or projects, so as not to only focus on content delivery. These things can be naturally nurtured and grown through challenging schemes of learning, with opportunities for choice, exhibiting work, drafting etc. exciting times ahead as usual!
LikeLike
Thanks Pete. RLO? Am I being dim?
LikeLike
It’s on your diagram! Real learning outcomes..
LikeLike
Of course!!
LikeLike
[…] http://headguruteacher.com/2015/04/25/processes-outcomes-and-measuring-what-we-value/ […]
LikeLike
[…] This post offers a vision of intelligent school accountability and measuring what is valued. […]
LikeLike
[…] http://headguruteacher.com/2015/04/25/processes-outcomes-and-measuring-what-we-value/ […]
LikeLike
[…] Review Systems: We’re continually looking to improve these. Any type of review has limitations and, most often, the effort to impact ratio is far too high. In many cases, you could sit down for 10 minutes and right down what the findings of a review process would be without actually doing it – because we’re scrutinising and observing what goes on all the time. Still, we’ve taken stock of ideas about the need for subject-specific departmental processes, the value of looking a certain themes across the school, the need to explicitly explore the effectiveness of leadership and management within teams and the validity of book-looks. We’ve considered the need for data-driven reviews versus soft-cycle reviews, the value of feedback from external consultants and our systems continue to change. […]
LikeLike
[…] what we value” and not just creating value in “what we measure”. This post by Tom Sherrington (@headguruteacher) about the following diagram is well worth a read and I am […]
LikeLike
[…] departments or a whole school, the same combination of soft and hard data is available. I’ve tried to suggest in this post that we need to give greater weight to ‘soft cycle’ data in order to judge a school, […]
LikeLike