
Now that Progress 8 has been born and looks like it’s here to stay, there’s no use wallowing for too long in outrage at the data-garbage bonkersness of it all. We might all agree that averaging out every child’s achievements across the school via a super-convoluted and arbitrary algorithm to generate a single number with a massive margin of error in order for schools to be judged and ranked – is INSANE. But let’s move on. Let’s explore what P8 tells us. Having received the detailed data from DFE on Monday, we’ve been examining how our P8 is constructed and, for some time now, we’ve been discussing how to use it constructively. Here are some observations.
- Curriculum structure
A positive feature of the Attainment 8, Progress 8 structure is that it does actually give a healthy weighting towards all students having a broad curriculum. The Ebacc slots and Open slots need to be filled in order to secure the best possible outcomes. Our most recent cohort followed a curriculum model I inherited that was not remotely designed to yield P8 maximisation. From 200 students only 136 had all 8 slots filled; 64 had at least one slot empty. The students with a full set of P8 slots averaged 0.3 higher than our overall P8 score. That’s an own goal in data terms – but actually it’s unhealthy for the students’ curriculum breadth. P8 does, therefore, introduce a strongly positive incentive to ensure all students are entered for enough subjects. There’s no incentive to fuel non-entries. A G counts more than a zero. There’s no incentive to reduce Science to Core -instead of Core+Additional.
There’s a mechanism that allocates subjects to slots to maximise the P8 score for Ebacc at the expense of the Open slots. That’s important to note. When French or History could be exchanged in the different slots, the highest score seems to go to the Ebacc slot – so the Open slot P8 average is likely to be less; it’s important not to see this as a performance issue; it’s largely a technical one.
The impact of non-Ebacc Humanities subjects is interesting. We had 8 students taking either Sociology or RE and no MFL; this left them with a vacant Ebacc slot because of the folly of denigrating these subjects relative to History and Geography. (You’ll never persuade me that Sociology is less academically rigorous than Geography.) However, at this scale, the impact is marginal on the overall P8 figure; it’s not a big deal to stick to our principles here instead of insisting on History or Geography for the non-linguists (who would be students taking extra English and Maths instead of MFL).
2. Every grade counts
Above all else, this is the most positive aspect of progress 8: every grade counts. I think this will be influential. We have seen that, as a consequence of the 5A*-C culture being so intense for so long, grades below C have had a falling-off-the-cliff effect. In order words, Ds slip to Es; Es slip to Gs – because the value given to the outcomes from all concerned has been too low. Now, the P8 mechanism reinforces the value of every grade. If a student falls back from a C prediction to a D, it’s vital to hold them there at the very least. The needs of a student on a B who could get an A need to be regarded as being as vital as those of a student moving from E to D. It’s crucial to give students a sense that any grade is better than none. I think this will change our psychology quite a bit. Hopefully any residual tendency in some departments to debate whether to enter students at the lowest end, for fear of getting Us, will stop. Who cares about Us if there’s a chance of a G or an F?
3. Cohort Profiles
I’ve found seeing the students’ individual Attainment 8 and Progress 8 scores hugely valuable. The biggest flaw in the P8 concept is that it ends up as an average. Averages are terrible measures – because school cohorts are so much more varied. I’ve produced profiles or our P8 and A8 scores so that I can see the range. This tells me far more than the average does. Year on year, the comparison of these profiles will be very instructive. Here are some illustrations based on dummy data, not my school’s.

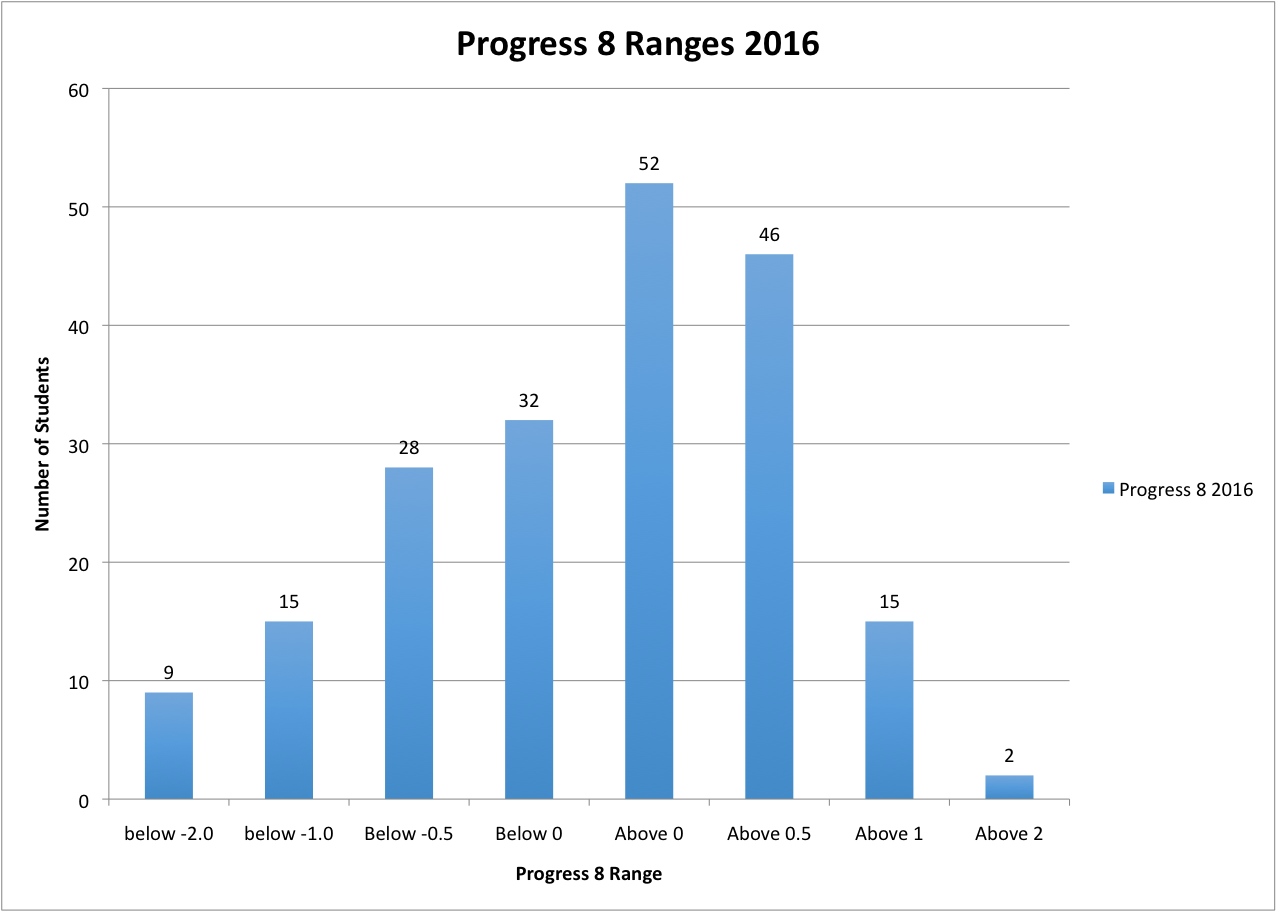
The balance of students achieving P8 averages above and below zero and the numbers gaining very high or very low scores is fascinating. Similarly, the profile of Attainment 8 scores is very interesting. It shows how wide the spread of outcomes is in my school. We might, in future, find success raising the very lowest end, the middle range or the very highest end – but we shall see by looking at the profile. The average P8 score will lose this detail.
4. The significant impact of outliers
This has been a huge eye-opener. In my school we had a minority of students who found the GCSE run-in very difficult to engage with; various chronic mental health or family difficulties took their toll and we had a tail of students who did not do well. The impact they had on P8 was HUGE. Our lowest scoring 18 students reduced our P8 score by 0.3. Our lowest scoring 7 students – who only took a smattering of exams and had individual P8 scores of -3.0 or below- reduced our overall P8 by 0.14. That’s the same size effect as the whole confidence interval of about +/- 0.15. It’s hugely significant. The effect of these students outweighs any number of other tweaks and imperfections elsewhere. A score of -3.0 means 30 Attainment 8 points lost from what was expected by one student; that’s the same as 30 students dropping one grade each.
To me, the mathematical weight given to the performance of outliers is a deep flaw in the whole mechanism. A few students who underachieve miserably create a totally disproportionate effect relative to the performance of the cohort as a whole. When schools are ranked by their P8 scores, this will be hidden; the true story will not be known and that is wrong. It seems absolutely obvious to me that schools should be able to remove outliers from their data in order to present a meaningful figure.
The implications are that we need to watch out very carefully for students who fall off the GCSE cliff. Writing students off is absolutely out of the question. Every grade we can get out of every student, whatever it takes with the resources we have, will matter. Previously, a student below the 5A*-C EM threshold might have represented a disappointment in a binary sense (over the bar, under the bar). Now, exactly how far they fall makes a big difference in this measure.
5. Diagnostic power
Finally, despite the problems with P8 as a meaningful, absolute measure of progress, there is some value in using internal comparison to trigger support and interventions. Previously, we might have targeted the C/D borderline students. Now, we’re looking at our lowest scoring P8 students. The lists are similar but not entirely the same. Here’s a small sample -with the P8 scores in rank order on the right:

Using colour coding in SIMS to trigger responses to concerns around individual subject grades is helpful. However, global support can be targeted at students with low P8 predictions. This includes some students who are securing Cs and Bs but should be getting As as well as those securing Fs who should be securing Ds and Cs. The P8 number itself means nothing of value; it’s only its position relative to the scale within the cohort that matters and this is useful.
My conclusion is that the most useful aspects of P8 are those that push us to support more students to succeed in more subjects, across the attainment spectrum. Even without playing any artificial games to plug some of the vacant slots with unrigorous qualifications, the P8 measure will be a positive influence on our thinking around curriculum entitlement for our lowest attaining students. Where it falls down is when all the detail is averaged out, losing all the meaning and nuance in what is a complex data set. Data profiles are the way to go as I’ve said before. P8 cohort profiles could be a thing of the future…that’s what we’ll be doing for sure.
Updates
- This is an interesting post on P8 as a floor standard measure from datalab: http://educationdatalab.org.uk/2016/10/how-should-we-define-ks4-floor-standards/
- I’ve found that the raw data in the P8 files allows us to calculate a useful and illuminating two-way table of P8 figures: Disadvantaged/Non-disadvantaged and Low, Middle and High prior attainers. This yields a figure for High prior attaining Disadvantaged students distinct from the overall figures for either category. In my school the figures vary and we have a different trend in relation to prior attainment for the PP and non-PP subgroups.
- I realised late in the day that there would be a national P8 score for Disadvantaged/Pupil Premium students overall – because their Attainment 8 is compared to the median attainment of all students for a given KS2 fine level. A message on twitter suggested this is -0.4. I don’t know the source. That’s significantly below 0.0. In a school like mine with 70% PP students, its important to know this figure so we can know how well our PP students did compared to PP students nationally as well as all students nationally. I don’t suppose the figure will be published officially until RAISEOnline comes out.

Great article, as always. Has given me a couple of new angles to look at and interrogate our data too.
One question though, where do you stand on a strategy that involves ‘trying to make the positive P8 scores even more positive’ through intervention rather than always targeting those with a low P8 score? As the whole thing is a mean average, any change upwards anywhere on the scale would cause a shift upwards.
I want to develop a ‘no child left behind’ approach on one hand where – as you rightly put it – nobody writes any students off. However, targeted students with a great attitude to learning and trying to add value there can sometimes yield more results than constantly targeted someone with a low P8 score and poor attitude to learning/school. I realise that the two and not always found together.
Any thoughts?
LikeLike
I think you need to balance what’s good for the school with what’s good for the students. Low P8s suggest underachievement so addressing that’s going to matter more to them in the hierarchy of priorities. But I agree – pushing for positives to be even more positive is sensible!
LikeLike
An individual’s child’s overall P8 score can be heavily influenced by underachievement in one of the buckets – be that ebacc/en/ma or open bucket so I still think its essential to look at the individual progress in each subject. Of course because of the way P8 is estimated its not possible to know this in a ‘group’ of subjects because there are so many variables to the P8 score in the grouped subjects. FFT aspire is, i think, producing some good stuff. I like the way it is developing its target setting system and the evaluation assessments are pretty sound too. OK it doesn’t do analysis of BTECs or vocational courses but is worthy of consideration. Outliers…..yes I 100% agree that these are often beyond the control or indeed influence of schools (or actually any other provision) and in many comparable statistical analysis such outliers would indeed be disregarded although I do get the moral imperative here. We had one student who was sectioned midway through y11. We kept in touch throughout; provided work while sectioned and then set up 1:1 provision when the student returned as they were unable to return to classrooms. P8 for that student was -1.7…..that included 3 x A grades! The student was able but it was actually nigh on physically impossible for this student to complete the 8 subjects!
LikeLike
Thanks for this Tom. As a parent, I welcome that this system appears to focus minds on picking up the tail of underperformers in order to boost overall performance. Its is welcome that there is such a strong focus on supporting those students. Though I recognise the interventions required may be beyond the scope of what the school can do.
LikeLike
I agreed with your original post on P8 that it sounded a good idea and in theory it could lead to all students needing to perform as moving from a B to an A for more able could be seen as extending them.
Yet the checking exercise shows that they have changed the KS2 scores based on this year’s performance for this year’s cohort, after the event. How are we meant to track and work on P8 if after the event they can say no not quite as good.
Did this affect you?
LikeLike
It affects everyone I think. It means that P8 values are only valid retrospectively. As a diagnostic tool they only work in-house with reference to a school cohort; the values themselves don’t mean anything.
LikeLike
As a subject leader in a high achieving school, (possibly incurring a rebuke from my SLT if they read this!) I confess still giving priority to C/D borderline students, rather than A/A* borderline for example. This is because I think it is in the best interests of students to “pass” and my job to prioritise those in danger of failing. For all the talk about this not being important any more, I think parents and industry will continue to look at grades which they consider to be a pass. Do you really think progress 8 will last indefinitely? My guess is that it won’t, at least not in its current form
LikeLike
I actually see the outliers as one of the positives when looked at in terms of our moral duty to students – more focus is likely to be put on these most vulnerable young people.
LikeLiked by 1 person
True. We should deal with it. It’s only a problem if P8 averages are used to compare school. Really we’re comparing how many extremely vulnerable complex children we have. To some extent.
LikeLike
I think it’s interesting that assessment of research excellence in higher education has moved to a profile score (and in four different categories) rather than a single figure. See for example http://results.ref.ac.uk/Results/ByUoa/5# This is clearly a more grown up, holistic way of characterising institutions (if indeed one has to do such).
LikeLiked by 1 person
Three problems, 1, these outliers have issues beyond the scope of the school. 2, it is in the schools interests to try and remove them given how big an effect they will have on P8 data, obviously this is bad. 3, these outliers cluster, given that you have one of the outliers the probability you have another is higher (think it was Jack Marwood who highlighted this).
LikeLike
In response to point 4 I wonder if you could have a system similar to scoring in gymnastics or diving. The top X number and bottom Y number of students are removed then the average taken.
Sounds silly and I’m sure it has just as many flaws!
Would also be interesting to look at the box plot of the p8 scores.
LikeLike
I was thinking the same thing…discount the lowest and highest 10%. The two values (with and without outliers) could be published side by side as a comparison.
LikeLike
I don’t think the top end effect is a distortion in the same way. You can’t perform artificially well; but you can score zero for reasons beyond the school’s control. I’d rather keep the high end and lose the genuine outliers at the lower end.
LikeLike
I appreciate the comments that writing students off is out of the question. Yet the problem of outliers has me really concerned. We all know those schools who had the same percentage of students with SEN as those that didn’t take GCSEs. In an ideal world those interventions and targeted support would help students at all levels, but by whom, how often and when? I can’t help thinking: Does this mean yet even more predjudice to wade through for students with mental health disorders? Will schools looking for a healthy P8 score look to sweep them under the carpet as they used to with SEN and disallow them from entering for exams? Will there be brave headteachers who stand up for the student as an individual who is unique and valued or will heads buckle under the pressure to buy in to the commodification of pupils as data in order to market their schools as attractive exam factories? Or will yet more pressure trickle down through the system causing heads of faculty to bear pressure on staff, who bring pressure to students exacerbating their anxiety, depression and damaging their mental health? It’s interesting to note that higher levels of anxiety and depression are commonly found amongst the highly talented and it is this cohort more than any other where the growing number of referrals to camhs are made. These are the students that are hugely at risk. I would give my all for a head who would hold back that potential tidal wave of misery. You cannot push a student to succeed. But you can create an environment where they can thrive if they feel that they matter more to a school than the data they generate.
LikeLike
Appreciate the concern. Clearly every student does and should count. The issue here is that the average measure doesn’t represent the school if outliers can skew it significantly. And they do. It becomes a measure of something else.
LikeLike
Whilst I agree that the top end doesn’t have the same skewing effect, as a scientist I’m uncomfortable with a statistical average (and that is all that P8 is) that discounts extreme values only at one end.
Not sure what the answer would be…
LikeLike
[…] via Dissecting Progress 8. The good, the bad and the ugly. — headguruteacher […]
LikeLike
I suspect that P8 score will be eventually regressed back to attainment %A*-C (or 5-9) as all previous value add systems have. If a school has a ‘good’ % basics measure – it’s simple for parents to understand and they/local press etc., will assume it’s better than another with a lower basics score.
WRT P8 scores at top end a basic flaw remains. GCSEs are capped (currently at A*) therefore being nuanced about performance for the more able group will always be difficult. Comparing schools full of more able with those with a more balanced (or less able) in-take is also a flawed premise.
P8 better overall – but will still not iron out inherent unfairnesses when comparing one institution with another.
LikeLiked by 2 people
I agree. It’s better as an internal tool than a public accountability measure.
LikeLike
Tom writes: “To me, the mathematical weight given to the performance of outliers is a deep flaw in the whole mechanism. A few students who underachieve miserably create a totally disproportionate effect relative to the performance of the cohort as a whole. … It seems absolutely obvious to me that schools should be able to remove outliers from their data in order to present a meaningful figure.”
I think that James Gordon is right in his response: “I actually see the outliers as one of the positives when looked at in terms of our moral duty to students – more focus is likely to be put on these most vulnerable young people.”
We, as a society, need schools to be supporting vulnerable kids going through tough times. I hope that P8 will – as James suggests – concentrate minds throughout KS3 as well as KS4. As soon as a kid who was heading for D grades (or whatever), appears to be going significantly off track, the intervention needs to happen. Even if it doesn’t get them to D grades, holding them at an E is **much** better than letting them slide away altogether.
P8 celebrates the performance of schools that are doing this really well. I hope that, over the next few years, P8 will lead all schools to study those who do this well, and to copy their best practice. So rather than schools listen to organisations giving tips of which subjects are easiest, or how to get more kids over the C/D borderline, schools will talk to each other about supporting the most vulnerable. Maybe I’m a dreamer, but I hope I am not the only one.
nb I don’t think that filling all 8 automatically helps the school. Adding one more pupil to the history class who really doesn’t want to be there, but gets a G, doesn’t help the school if they are disruptive, or take up teacher time if one other pupil falls back by one grade. If >1 pupil falls back a grade, then the P8 score actually falls. P8 definitely doesn’t mean that it is in a school’s interests for all pupils to take 8 P8 subjects.
LikeLiked by 1 person
Outliers can’t always be seen coming. Know of one school where a PP eligible student was on track for A and B grades across board. Would have given her a positive p8 score based on her ka2 results. There was a crisis event in her life and she took no exams at all. School supported her brilliantly through that event (which matters more than anything else) and has taken her through to sixth form anyway.
Of course her P8 score is very negative – a true outlier within the school and the Pp cohort. Important that inspectors look beyond the ‘headline’ stats at the stories. In this case this one outlier drove the PP p8 score from above zero to a significant negative score. Of course these are published stats too and schools can’t share the stories with the general public so school reputations can be impacted.
LikeLiked by 1 person
Tim – I absolutely agree with the sentiment…it is only right that schools support the vulnerable and stand by them. The trouble is that in doing just that for two non-attenders for very significant health conditions, our school has, as a reward for its trouble, had its P8 described as average. Removing those 2 outliers from the data sees a jump from 0.21 to 0.30 – which would put us in the above average pile. For doing the right thing, there is a degree of public opprobrium and we then have to “explain it” to interested parties. More importantly, the description of average is misleading to anyone using the DfE site to compare schools. That said, P8 is a significant improvement as a key indicator – it would just be so much more useful to parents if each school had the option to remove a designated small proportion of outliers (e.g up to 3% of students).
LikeLike
Progress 8 compares a school’s mean Attainment 8 score with a national average score. The only slight complexity is that this average changes for each school to take account of differences in intake (based on KS2) between schools. As such, I do not recognise it as a “super-convoluted and arbitrary algorithm to generate a single number with a massive margin of error.”
Any measure based on points scores, whether raw attainment or value added, will be liable to outliers exerting disproportionate influence. This has always been the case affecting (for example) average ‘best 8’ points scores and their associated value added scores. In fact, you could argue that the effects of outliers have been attenuated slightly under P8 as in previous value added measures there was a massive gap between grade G and grade U/ not being entered.
First and foremost, the purpose of Progress 8 is to define a floor standard. We’ll have to leave aside the question of whether floor standards are justified. This then leaves us with the question of whether a P8 score of -0.5 or lower is a reasonable method of identifying schools where students are systematically achieving lower KS4 outcomes than other students with similar KS2 prior attainment. We (Education Datalab) will blog on this separately.
Beyond its use in the floor, I agree that an average score is of little practical use to a school but an analysis of the underlying variation between students may well be helpful.
LikeLike
Thanks.Even the KS2 fine points average is convoluted. A8 slots are an arbitrary construct. It’s all logical and mathematically sound but it is given meaning in relation to learning that isn’t deserved. School A = -0.25. That’s a pretty weird concept in my book. The significance error bars are very big too. I think we should say more about that.
LikeLike
There is much to be said about the precision of scores. P8 does tend to show that there is actually very little difference in attainment (as measured by Attainment8) between the majority of schools once the effects of prior attainment are removed. I think it’s worth saying that a bit more often too.
LikeLike
[…] If a pupil with high prior attainment is affected in such a way then his or her P8 score would be large and negative, and potentially exert a relatively large influence on the school’s average P8 score. Tom Sherrington has blogged about this recently. […]
LikeLike
[…] Sherrington’s reflection on his school’s Progress 8 scores is a fascinating read, Dissecting Progress. The Good, the bad and the ugly. Last year Simon Eccles (@Head_stmarys), the headteacher at St. Mary’s, introduced me to the […]
LikeLike
Hi Tom,
Can I ask how you have colour-coded in your spreadsheet? Many thanks
LikeLike
Hi. Yes. It’s based on teacher assessment/predictions vs FFT20 targets.
LikeLike
[…] to do in practice when so much weight is placed on data outcomes in our accountability system. (See Progress 8 discussion here.) Averaging out all the complexity to produce simple numerical measures is a major flaw in our […]
LikeLike
Can Progress 8 be used to compare groups in a GCSE or between different GCSE’s in the same school?
LikeLike
Nothing is an exact science! Some schools use residuals to compare performance across different subjects – I think that is deeply flawed. P8 across different subjects is also an issue because of the ‘average’ scenario and indeed ‘which three subjects’ are used for the average in ebacc bucket or open bucket as there can be considerable variation. Indeed the Standard Deviation in any of the buckets is over 1. One can calculate P8 for individual subjects but i don’t think it should be used to compare (indeed I’ve done it for all my classes at my school and found it inconclusive and not used it). However, i do think there is a little more mileage in using P8 to compere performance in En in a large department and in Maths in a large department. There is then though Standard Deviation or confidence intervals to take into account. One student in one class can also have a significant impact so the outliers issue (both positive and negative…you can’t have your cake and eat it?) comes in to play. Nevertheless I do think P8 is a fairer measure than we have had before and I have been interested to see at whole school level those schools who have been ranked as good by ofsted and come out with -1.2 or worse! It will be interesting to see the repsonse.
LikeLike
[…] blog, Dissecting Progress 8: The good, the bad and the ugly – where I explore the issue of […]
LikeLike